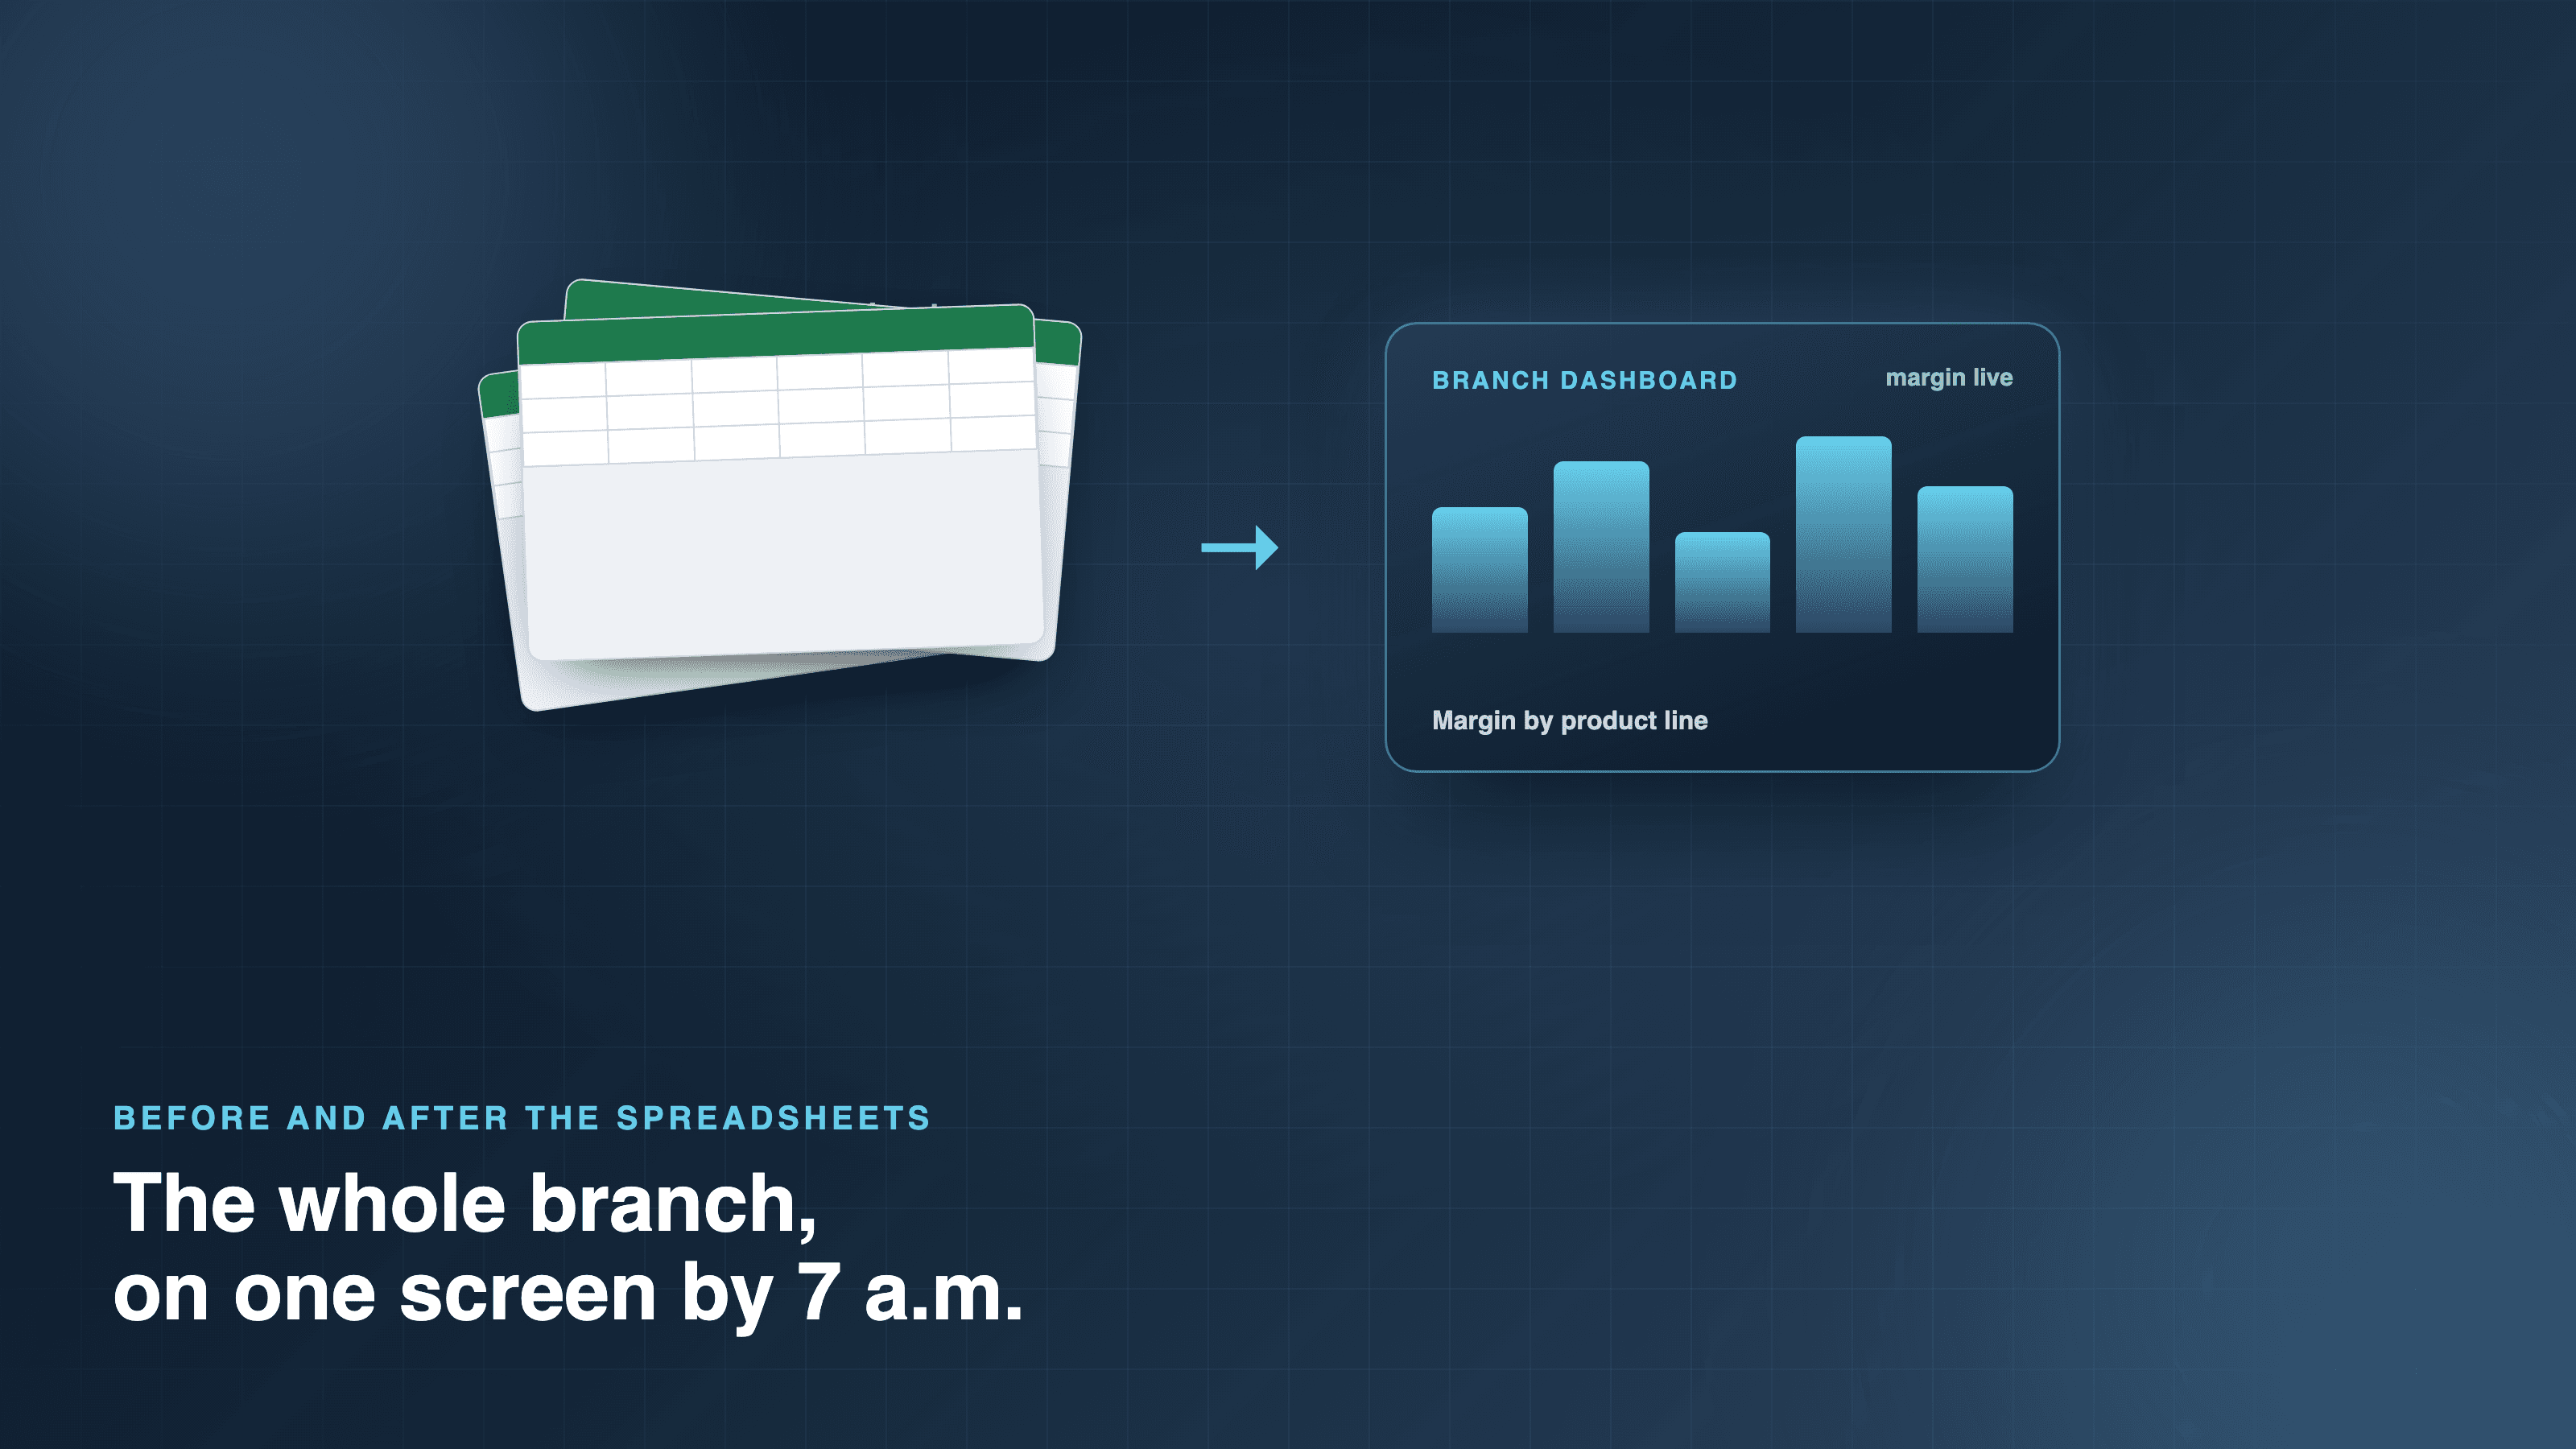
A distribution branch manager's day without Excel starts with one screen instead of five spreadsheets. Instead of two hours reconciling yesterday's numbers by hand before the first contractor calls, the margin, the inventory, and the pricing are already on one dashboard when he logs in. What follows is a picture of that shift, the same morning told twice, before and after a data visibility layer went in on top of the branch's existing ERP.
This is a composite scenario, not a case study. It reflects patterns we see across regional distribution branches, not one real customer.
The morning that starts with five spreadsheets
Before, the day began with a ritual. He would sit down, open Epicor, and then open five Excel files next to it. One tracked inventory he did not trust the system to have right. One held the pricing he worked out by hand for the accounts that did not fit standard tiers. One tracked rebates, because those lived nowhere the ERP could show them cleanly. One was yesterday's orders, exported and re-sorted. The last was the running margin sheet he rebuilt every week and never fully believed.
The first two hours went to reconciliation. Numbers from Epicor did not line up with the spreadsheets, so he chased the difference, copied figures across, and patched the gaps by memory. None of that work created anything. It only got him to the point where he could start to trust what he was looking at, and by then the morning was half gone.
By ten, the numbers still are not ready
At ten, the first contractor called asking about an order and a price. By then he had a rough read on inventory, but he still did not know the margin on yesterday's orders, because that sheet was the last one he rebuilt and he had not gotten to it. So he answered the way most branch managers answer, from instinct and experience, quoting a price that felt right rather than one he had checked.
That is where the quiet losses lived. Inventory was verified by hand, so it was always a little stale. Pricing leaned on gut, so some deals gave away margin no one noticed. Rebates sat in their own file, so they were easy to forget at exactly the moment they mattered. And the real sting came at month end, when the actual margin landed and it did not match the running story he had been telling himself all month. The surprises were never good ones. This is the same pull we described in why teams drift back to Excel after a new system launches: the spreadsheets fill the gap the system left open.
The same morning, one dashboard later
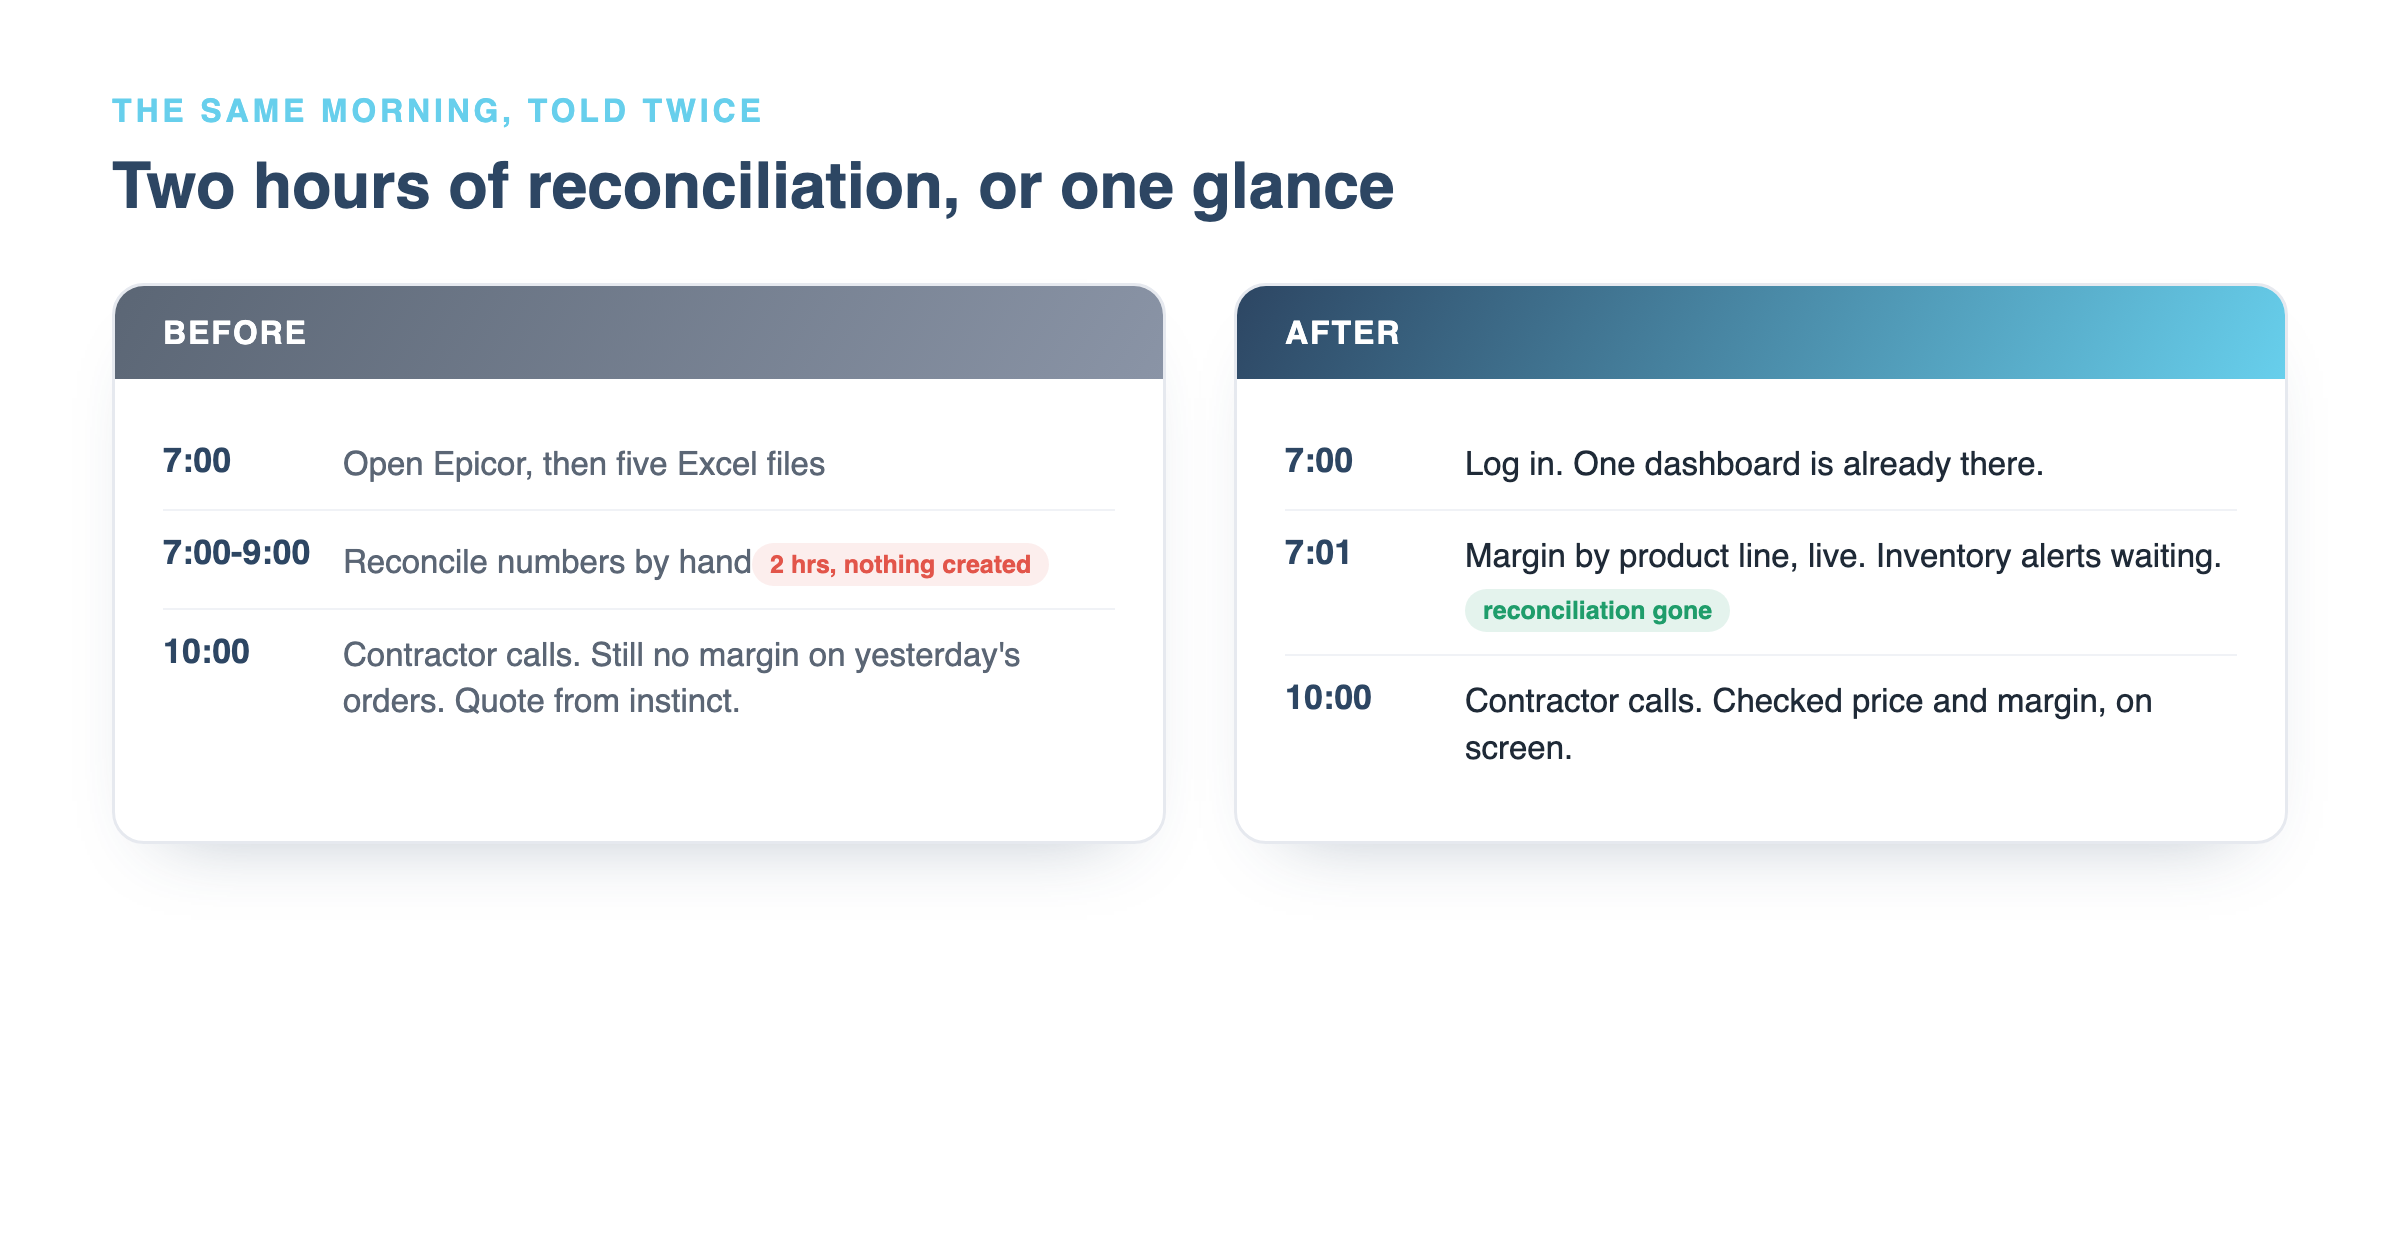
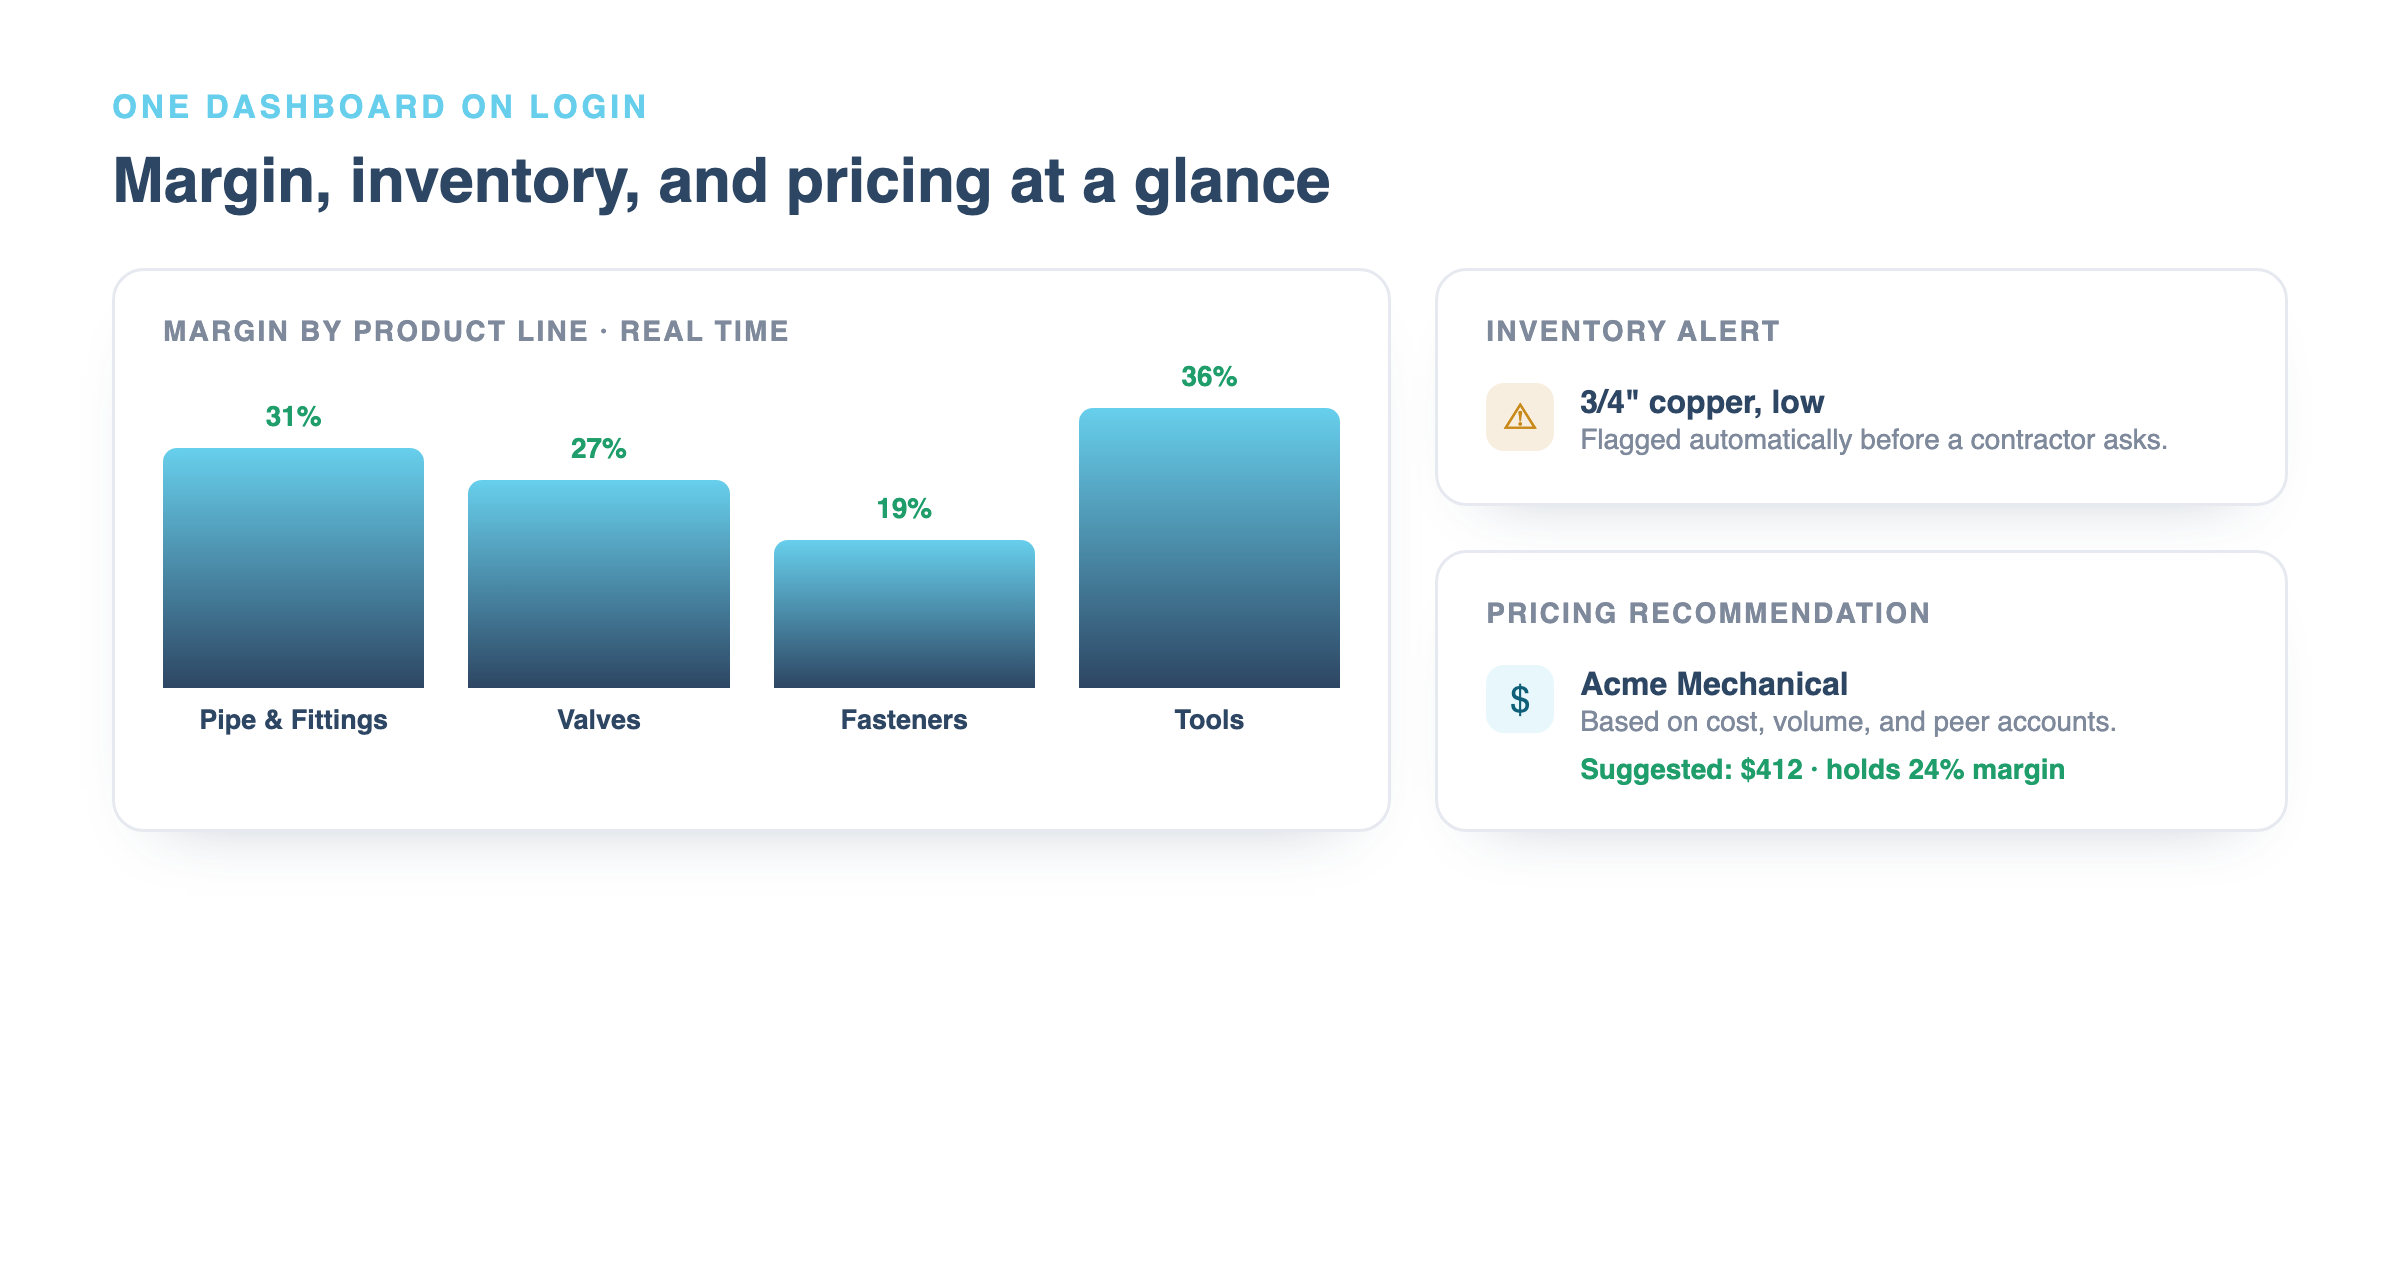
After the visibility layer went in, the morning looks nothing like that. He logs in and one dashboard is already there. Margin by product line, real time, pulled straight from the same Epicor data he used to reconcile by hand. Inventory levels are live, and the alerts come to him rather than waiting to be found, so a short SKU flags itself before a contractor asks. Pricing carries a data-driven recommendation next to it, grounded in cost, volume, and what similar accounts actually pay, so the ten o'clock call gets a checked answer instead of a guess. When someone upstairs wants the branch numbers, the report that used to eat an afternoon generates in about thirty seconds.
The two hours of reconciliation are simply gone, because the numbers no longer need to be assembled. They are already assembled, and they are the real ones.
From managing spreadsheets to managing the business
The change that matters is not the time saved, though the time is real. It is what the time gets spent on instead. The morning that used to go to rebuilding sheets now goes to the branch itself: which product lines are slipping, which accounts are quietly unprofitable, which contractor is worth a call today. He went from managing spreadsheets to managing his business. The job he was hired to do, the judgment part, is the part he finally has room for.
None of this required naming him a data analyst or handing him a new system to learn. The dashboard speaks in the terms he already thinks in, product lines, margins, accounts, and stock, so the shift felt less like new software and more like the fog lifting.
What actually changed underneath
The branch did not replace Epicor. That is the part people expect to hear and do not. The visibility layer sits on top of the ERP the branch already runs, reads the same data that was always there, and presents it in one place in real time. The spreadsheets existed because the data was trapped in a system that could store it but not show it well. Connecting that data and surfacing it, rather than ripping the ERP out and starting over, is the whole approach, and it is the same one behind our Epicor and Prophet 21 visibility work and our unified operational dashboard case. The systems already hold the numbers. The layer just lets a branch manager see them without rebuilding them by hand every morning.
Frequently asked questions
What is a data visibility layer?
It is a dashboard and data layer that sits on top of an existing ERP and other systems, reads their data, and presents it in one place in real time. It does not replace the ERP or move the data out of it. For a branch manager, it turns numbers that were trapped inside Epicor and scattered across spreadsheets into a single live view of margin, inventory, and pricing.
Do you have to replace Epicor to get this?
No. The layer is built on top of Epicor and reads the same data already in it. Nothing is ripped out and no migration is required. That is the point of the approach: the ERP keeps running as the system of record while the visibility layer makes its data usable day to day.
Why do branch managers end up running the business from spreadsheets?
Because the ERP can store the data but not show it in the form they need, so they export it and rebuild it by hand in Excel to track inventory, pricing, rebates, and margin. The spreadsheets are a workaround for a visibility gap, not a preference. Remove the gap and the reason to keep the spreadsheets goes with it.
How long does it take to put a visibility layer in place?
For a single branch or process, this kind of layer is typically built in a matter of weeks rather than a long rollout, because it connects to systems that already exist instead of replacing them. The scope is deliberately narrow at the start, one clear view built on real data, which is what makes a short timeline realistic.
Is this a real customer story?
No. It is a composite scenario built from patterns common across regional distribution branches, written to show a typical before and after. It is not based on a single real customer and the details are illustrative rather than a specific account.
What would your morning look like without Excel
The branch manager in this story is a composite, but the morning is not unusual. Reconciliation before ten, pricing by instinct, and margin surprises at month end are the normal cost of running a branch on a system that stores data but does not show it. The fix is not a new ERP. It is a layer that lets the numbers already sitting in the one you have show up in a form you can actually run the branch from. 3ALICA builds that visibility layer on the systems a distributor already runs.
The view described here is what the Operational KPI Sprint builds on top of the systems a branch already runs.