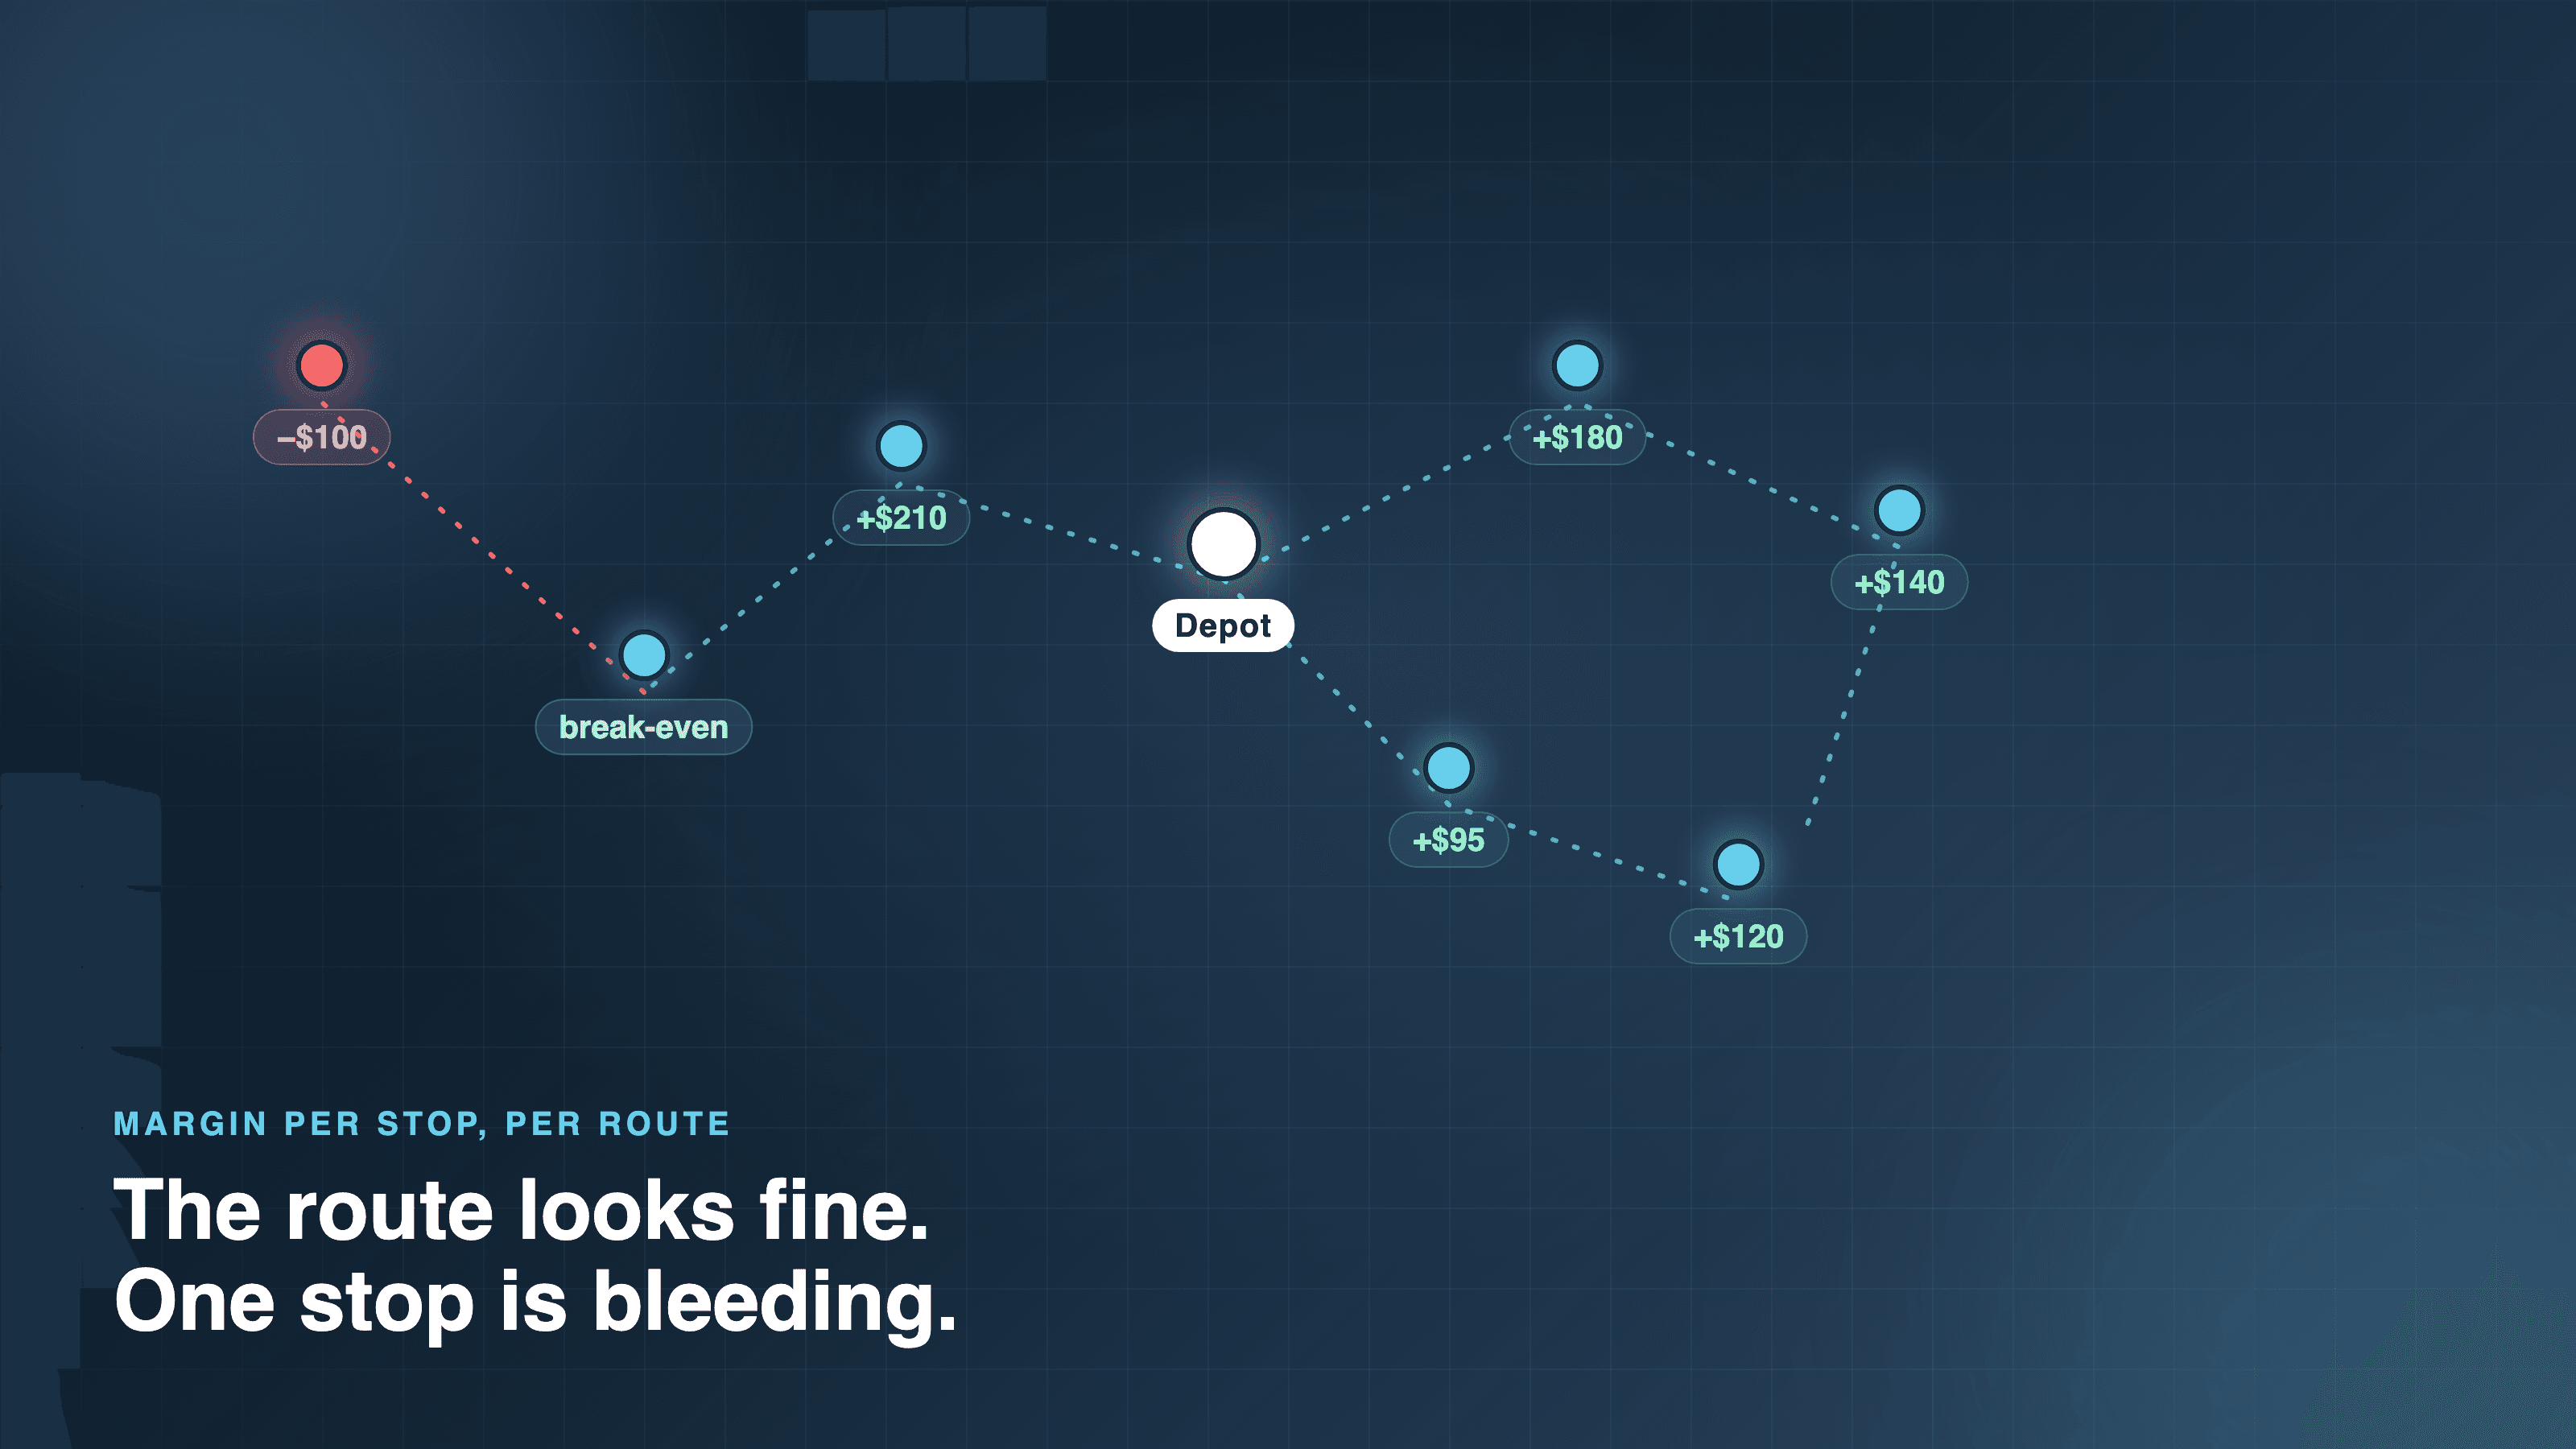
Most regional food distributors know their overall margin but not their margin per route, and when they finally measure it, 15 to 25 percent of routes are running at a loss. The reason is structural, not a management failure. Revenue is booked cleanly against each route, but the cost of delivering it, fuel, driver hours, truck wear, and spoilage along the way, gets spread across the whole operation. So the losing routes hide inside a healthy company average, and the customers who cost the most to serve often look like the loyal ones.
Revenue is measured by route, cost is not
The gap is almost always the same. A distributor can tell you exactly what each route sold last month, because that number falls out of the order system without effort. Ask what each route cost to run and the answer turns into an allocation, total delivery expense divided across all routes, which quietly assumes every route is average. None of them are. A tight urban loop with twelve stops in twenty miles and a rural run with four stops across ninety miles get charged the same per-delivery cost, even though one burns a fraction of the fuel and driver time of the other. The moment cost stops being a company-wide average and gets tied to the specific route, the picture changes.
The unprofitable route hides inside a healthy average
A company running a comfortable blended margin can still be carrying routes that lose money on every run, because the profitable routes cover for them. That averaging is the whole problem. Gartner noted in 2025 that most supply chain leaders already suspect some of their customers and products are unprofitable, but lack a structured way to prove which ones. Distribution is where that suspicion is most expensive to leave unmeasured, because the cost of a delivery is real, recurring, and rising. The average cost to operate a truck reached $2.26 per mile in 2024, and the marginal cost excluding fuel hit the highest level ever recorded, driven by equipment and driver wages (ATRI). Every extra mile to a small stop is charged at that rate whether or not anyone is watching.
Where the money actually leaks
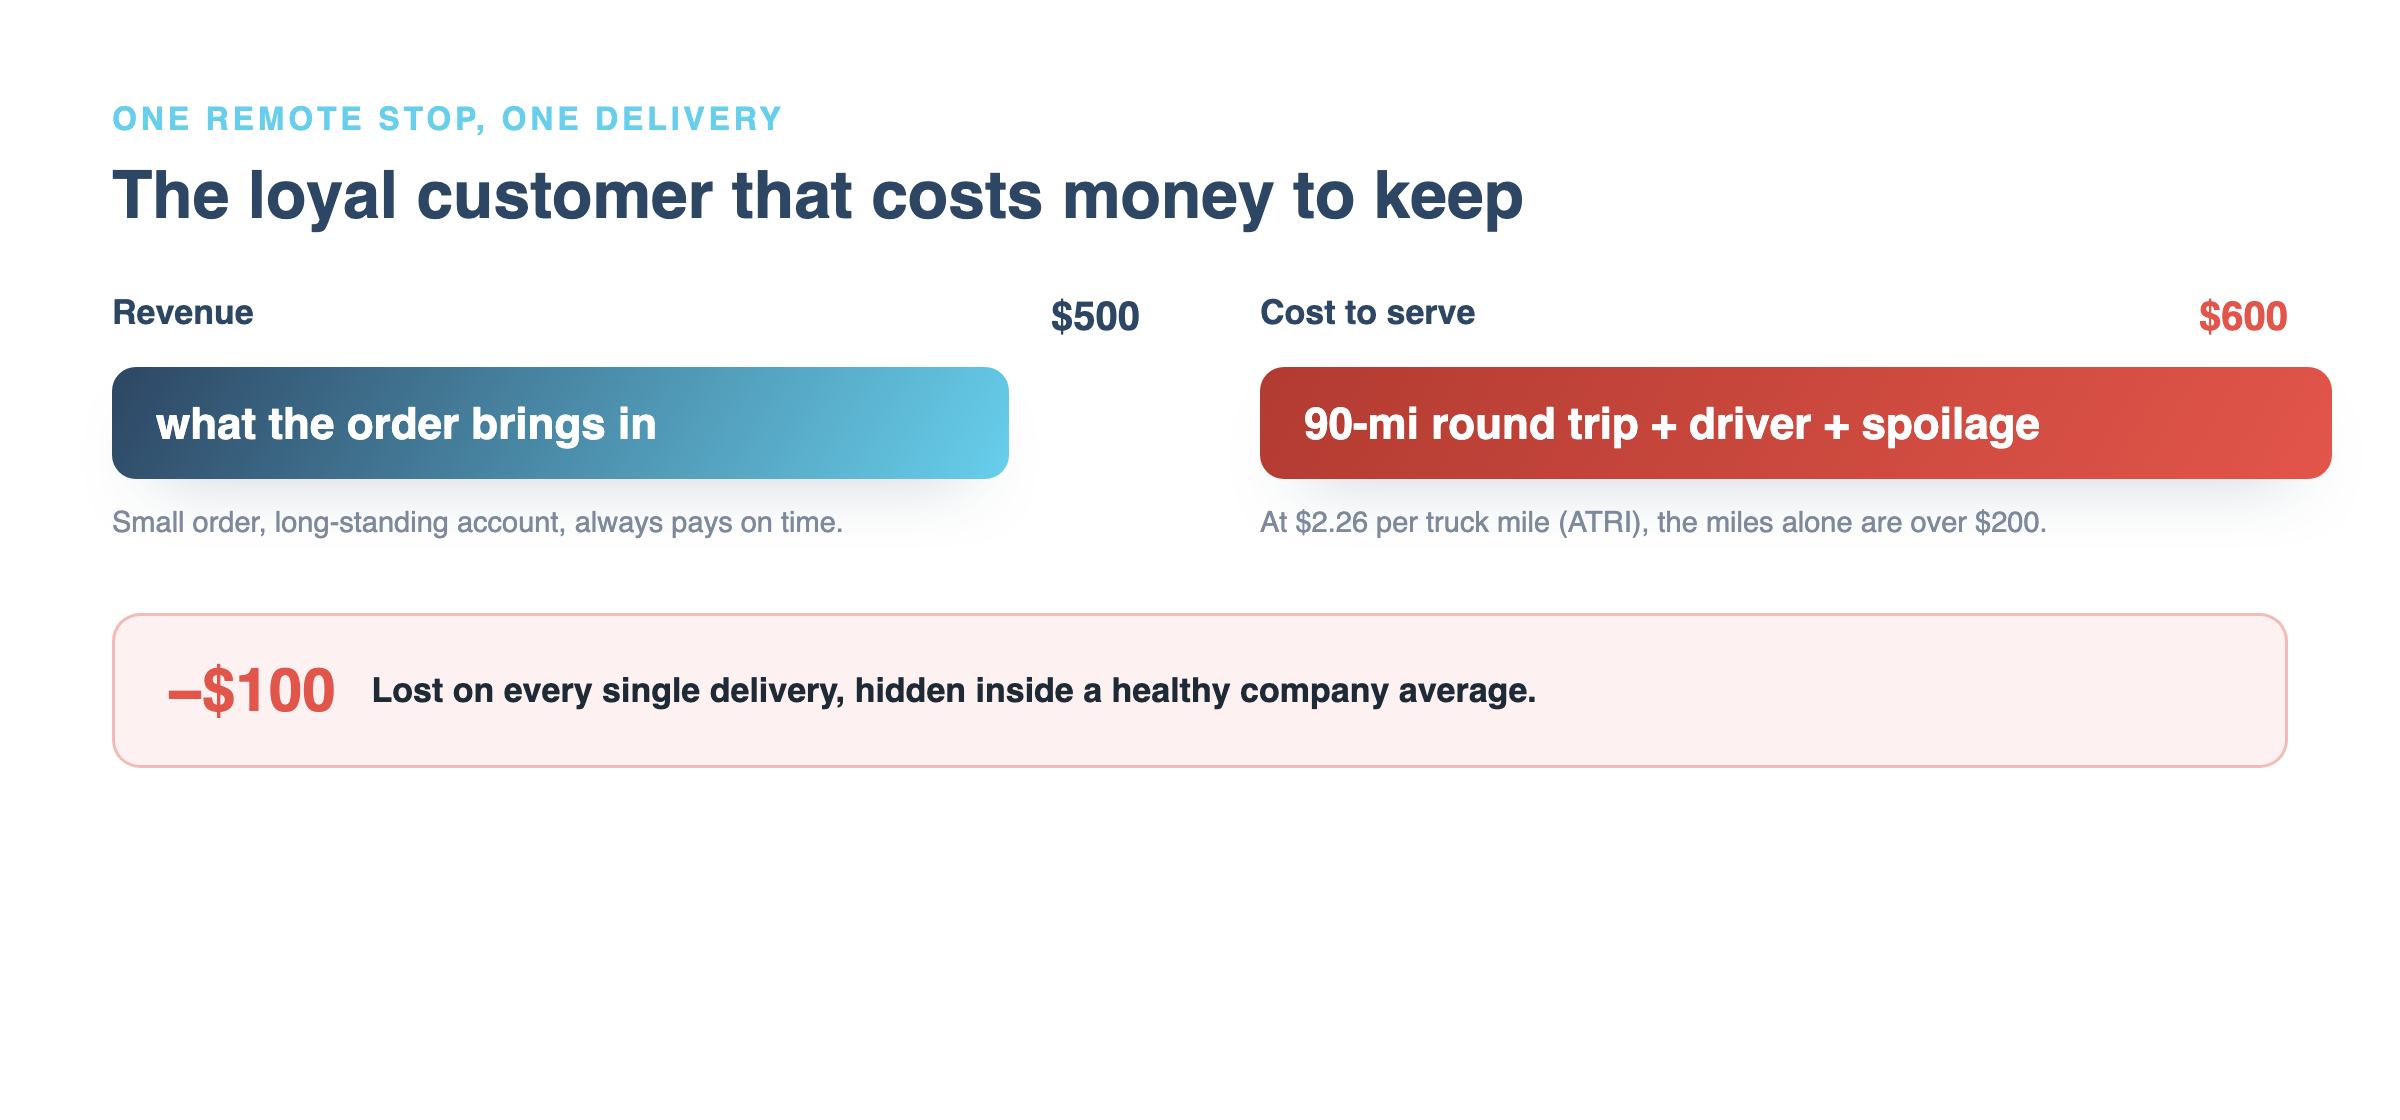
The losses concentrate in a familiar pattern: small customers on long routes. A stop that brings in $500 a delivery can easily cost $600 to serve once the miles, the driver time, and the spoilage risk are counted. At $2.26 a mile, a ninety-mile round trip is more than $200 in truck cost alone before the driver even walks the order in, and perishable freight adds shrink on top. These are frequently the accounts a distributor is proud of, the long-standing loyal customers, which is exactly why the loss goes unquestioned. Loyalty and profitability are not the same measurement, and a route report is the only place the difference shows up. The same blind spot shows up upstream in how orders arrive, which we covered in why most food distribution orders still come in by phone.
What route-level visibility changes
Once margin is visible per route and per stop, four levers open up, and none of them require firing customers. Route redesign moves stops between routes so long legs get consolidated or resequenced. Order minimums for remote customers turn a $500 loss-maker into a break-even or better without ending the relationship, because the customer either consolidates orders or absorbs a delivery fee. Load optimization fills the truck closer to capacity on the runs that are already going out. Dynamic scheduling stops sending a truck to a distant stop for a small order that could wait for the next run in that direction. Each one is a normal operating decision that was impossible to make while every route looked average.
How to measure route profitability
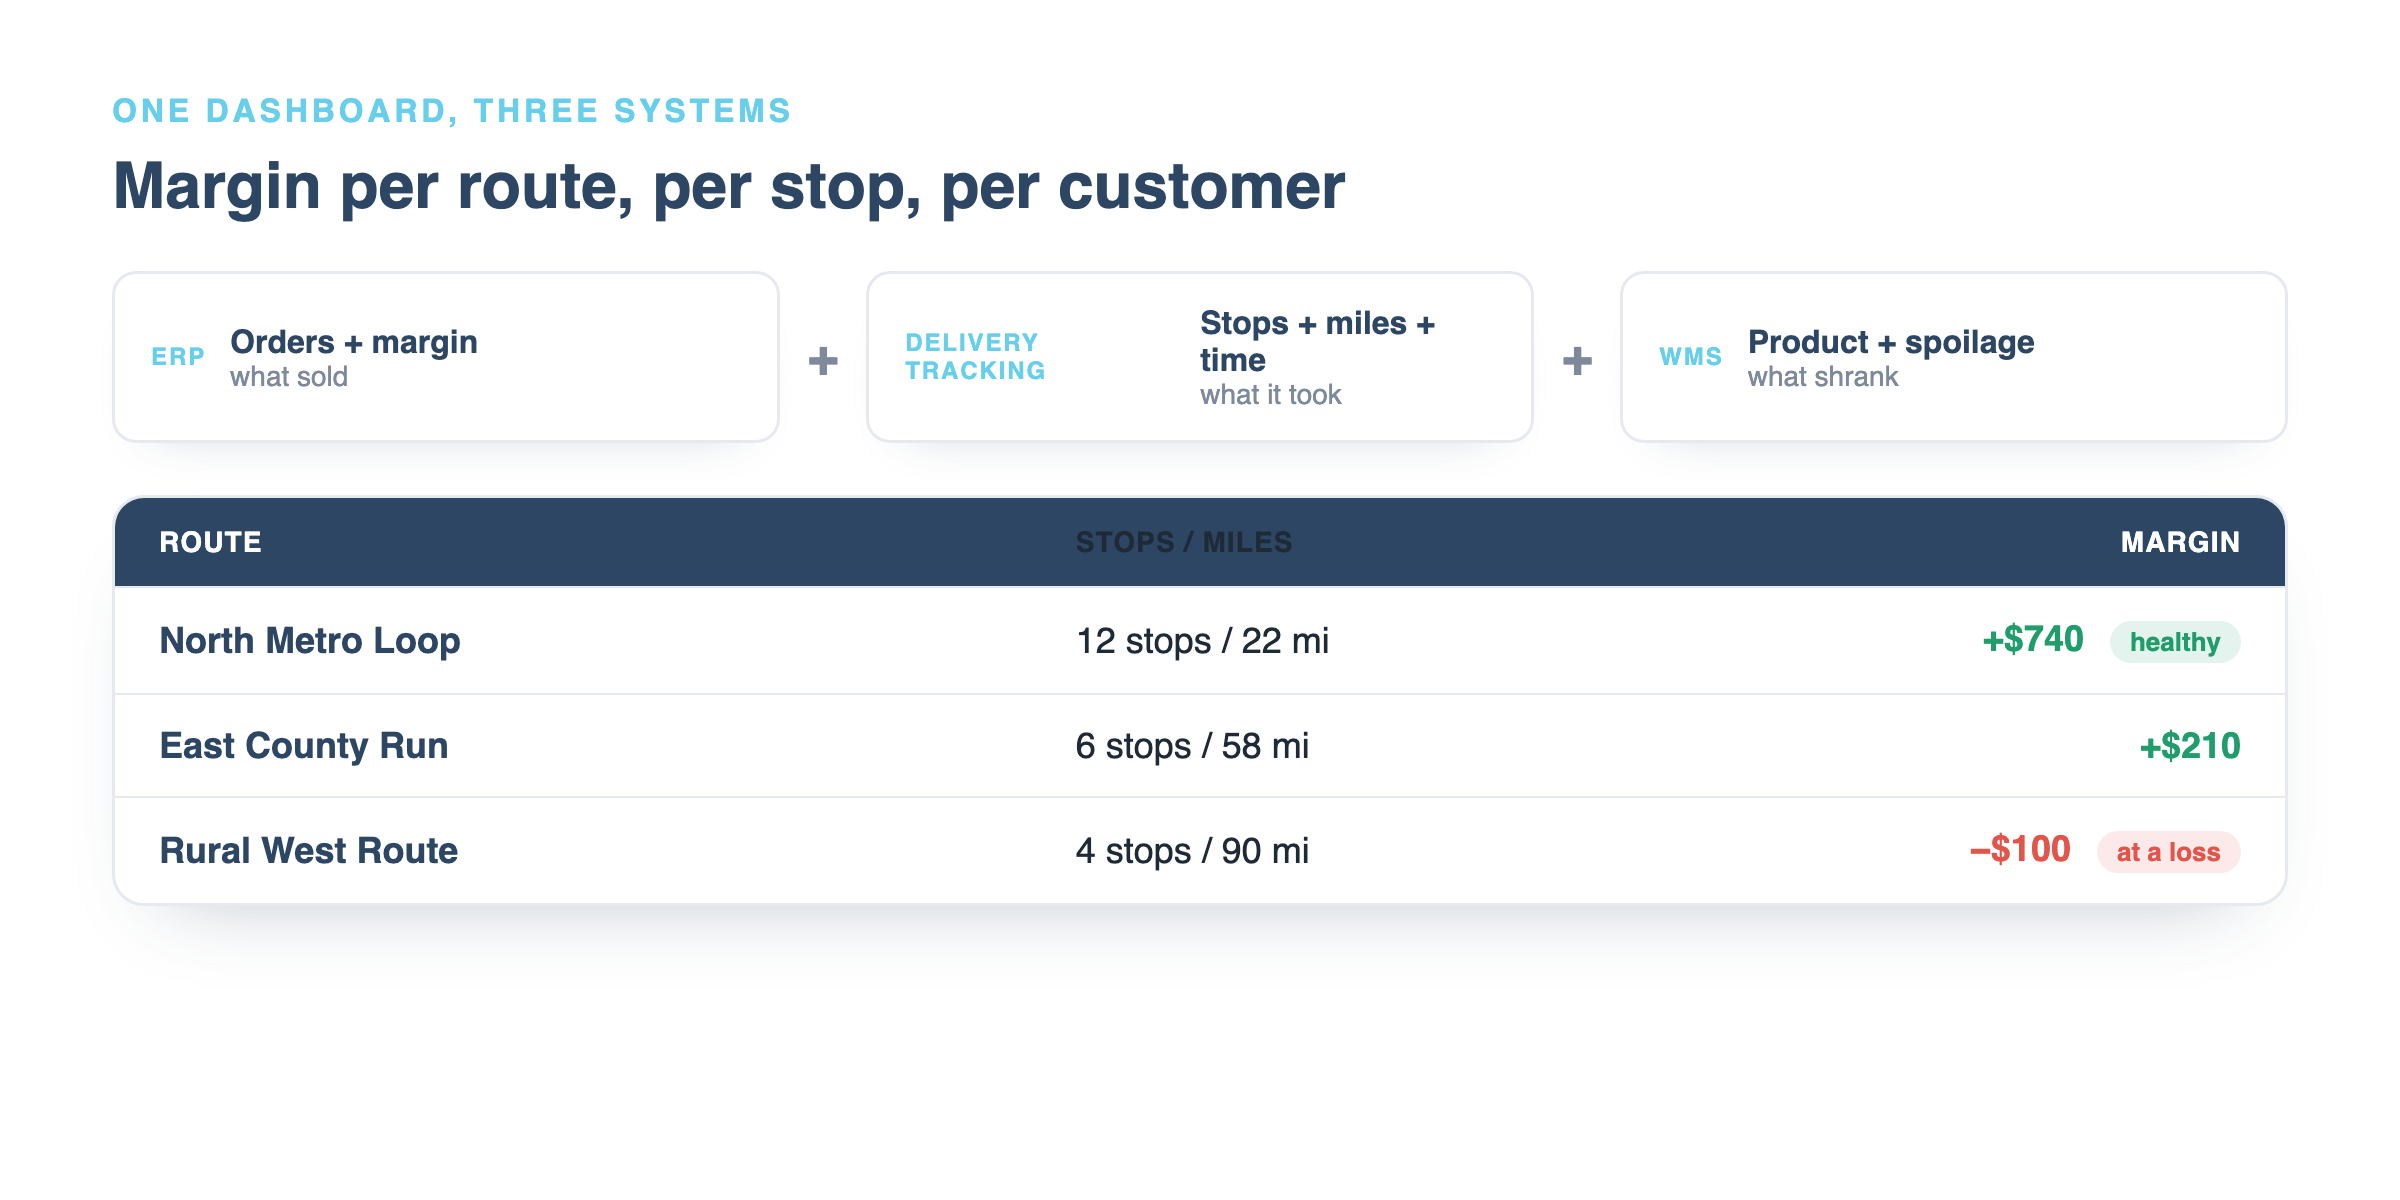
Route profitability is measured by pulling three data sources together that usually never meet. The order and margin data lives in the ERP. The delivery detail, stops, sequence, miles, and time, lives in delivery tracking or telematics. The product and spoilage detail lives in the WMS. A dashboard that joins them can express one clean number: margin per route, then per stop, then per customer. Nothing needs to be ripped out to do this. The systems already hold the data; it is sitting in separate places that were never designed to be read together. Building that connecting layer, rather than replacing the systems under it, is the fast path, and it is the same visibility approach behind our distributor network analytics work and a manufacturer's real-time margin dashboard.
Start with the routes you already suspect
Most operators can name two or three routes they have a bad feeling about. That is the place to start, not a full cost-to-serve overhaul. Measuring even a handful of suspect routes against real per-mile cost usually confirms the feeling and quantifies it, which is enough to justify the first change. From there the same model extends across the network. The goal is not to punish low-margin routes, it is to see them clearly enough to fix them, and to stop the profitable routes from silently subsidizing the ones that are not.
Frequently asked questions
How many delivery routes are actually unprofitable?
For most regional distributors, 15 to 25 percent of routes run at a loss once cost is measured per route instead of averaged. The routes look fine on the blended company margin because the profitable ones cover them. Cost-to-serve research more broadly finds that a large share of customers are unprofitable, and Gartner reported in 2025 that most supply chain leaders suspect it but cannot yet prove which ones.
Why do distributors not already know their route profitability?
Because revenue is easy to attribute and cost is not. Sales fall out of the order system per route automatically, but delivery cost, fuel, driver hours, truck maintenance, and spoilage, is typically booked as one operational total and spread evenly across routes. That averaging assumes every route is the same, which hides the long, thin routes that lose money on every run.
How much does it really cost to run a delivery route?
More than most allocations assume. The average cost to operate a truck reached $2.26 per mile in 2024, with non-fuel marginal cost at a record high driven by equipment payments and driver wages (ATRI). A ninety-mile round trip to a remote customer is over $200 in truck operating cost alone, before driver time at the stop and any spoilage on perishable freight.
Do we have to drop unprofitable customers?
No, and that is usually the wrong move. Route-level visibility opens gentler fixes first: order minimums for remote accounts, consolidating deliveries onto fewer runs, resequencing stops, and filling trucks closer to capacity. Most loss-making stops can be brought to break-even by changing how they are served rather than ending the relationship.
What data do you need to measure margin per route?
Three sources that usually sit apart: the ERP for order and margin data, delivery tracking or telematics for stops, miles, and time, and the WMS for product and spoilage detail. Joined in a dashboard, they produce margin per route, per stop, and per customer. The data already exists inside the business; the work is connecting it, not collecting it.
See which routes are making you money
The routes losing money are already running today, and they will keep running until the numbers are put in front of someone. Measuring even a few suspect routes against real per-mile cost is usually enough to confirm the problem and justify the first fix. 3ALICA builds route profitability visibility on top of the WMS, ERP, and delivery systems a distributor already runs, so the answer comes from the data that is already there.
Sources
- American Transportation Research Institute, An Analysis of the Operational Costs of Trucking: 2025 Update (average cost $2.26 per mile in 2024, record non-fuel marginal cost)
- Gartner, supply chain leaders should implement a cost-to-serve model to assess customer and product profitability (2025)
Measuring route-level profitability against the systems you already run is our logistics work.